In the afrimapr project we aim to help develop R spatial data skills in Africa. We are developing tutorials and just starting on a book.
We realised it is not straightforward to find African datasets for learning and teaching.
To make it easier for learners, others developing training materials and ourselves, we have created a data package, afrilearndata, containing example open datasets located in Africa.
These example datasets are deliberately rather small so that they are easy for learners (& trainers!) to manage. The intention is also that they can be used together to teach a range of spatial data techniques. We have tidied them up so that they have enough data to be able to illustrate different concepts, but not so much data that could be confusing for new learners, or slow down older computers.
The package currently contains these objects :
- africountries: polygons, country boundaries
- africontinent: polygons, continent outline
- afrihighway: lines, trans african highway network
- africapitals: points, capital cities
- afripop2020: raster, population density 2020 aggregated to 20km (WorldPop)
- afripop2000: raster, as above for year 2000
Sources are indicated in the package documentation and reproducible code to create the data from public sources is included as a part of the package.
Here are 4 of the data layers displayed together using the package tmap. The code to create this plot is given in the afrilearndata readme.
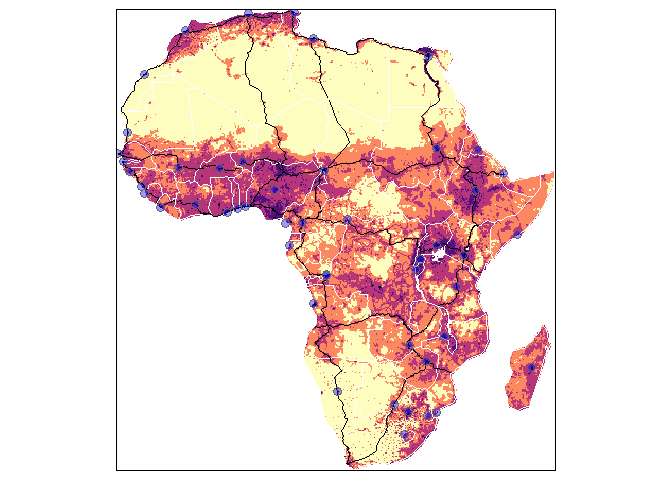
We took inspiration from the spData package. As well as having the data as R objects that can be used straightaway, we also store them as a range of geographic data file types (e.g. .shp, .gpkg, .kml, .tiff) so that the files can be used to demonstrate the data reading process.
Our approach aims to follow rule 2 (Make Lessons Modular) of the Ten simple rules for collaborative lesson development. By creating teaching data as a separate 'module' it allows us to use it in different teaching resources, and it allows others to repurpose it for their own needs. Also, we aim to encourage and empower contributors (rule 4) and smaller modules are likely to be less intimidating.
There are-trade offs in the amount of data to include that we continue to consider. Small is good in that it allows easy download in areas with poor internet connection and easy manipulation on slower computers. Adding more data could increase interest and utility but we want to be careful not to lose the benefits of smallness. Initially we've started by making sure we have examples of the main spatial data types, vector points, lines and polygons, and raster. These should allow illustration of many useful spatial data operations.
For raster data we downloaded data from the excellent WorldPop population estimates for the globe. Worldpop 1km resolution data (the lowest resolution they provide) cut to Africa gives ~ 8000 * 8000 cells, that takes up a fair amount of space, a while to download and time to process. Aggregating the data to 20km cells reduces this to ~ 400 * 400 cells, much more manageable but still showing interesting patterns. We considered using an even lower resolution but this had the unfortunate side effect that the highest population density cell on the continent (near Lagos) ended up in the sea. Potential problems with aggregation are an issue but again we don't want to minimise potential confusion for new users.
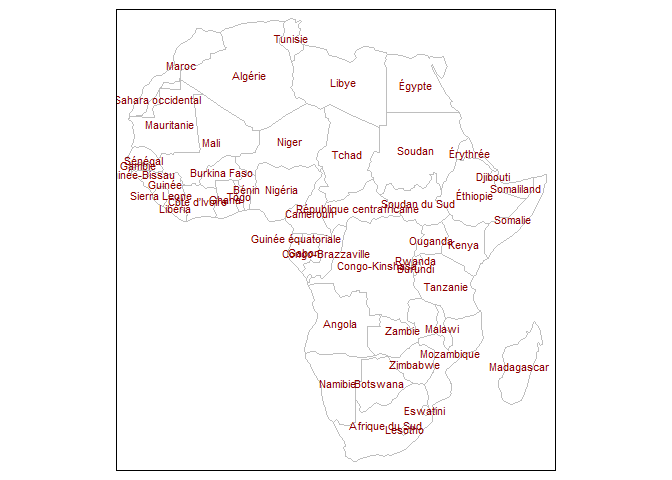
For the country boundary data (africountries) we've made a start towards supporting other languages by adding country names in French (see below), Portuguese, Afrikaans and Swahili. We are thinking of ways to improve language support in our materials more generally.
If you have any suggestions for how we could improve the afrilearndata package, do get in touch.