Back in March we hosted a showcase and Q&A during Open Education Week. The aim was to share the vision for what we are doing, gain an indication of interest from our audience and to answer questions. The video and slides can be viewed here.
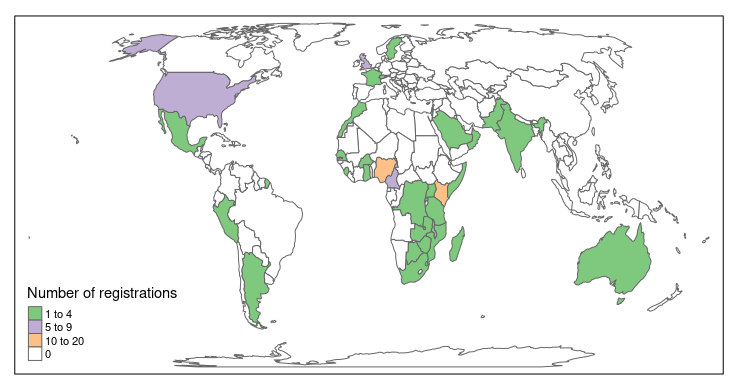
105 people registered and 30 attended on the day. We were pleased to get such a level of interest, mostly through promotion on twitter. More than 70% of registrations were from Africa with 21 countries represented including the top two, Kenya & Nigeria.
Survey responses from those that registered will help us target our efforts.
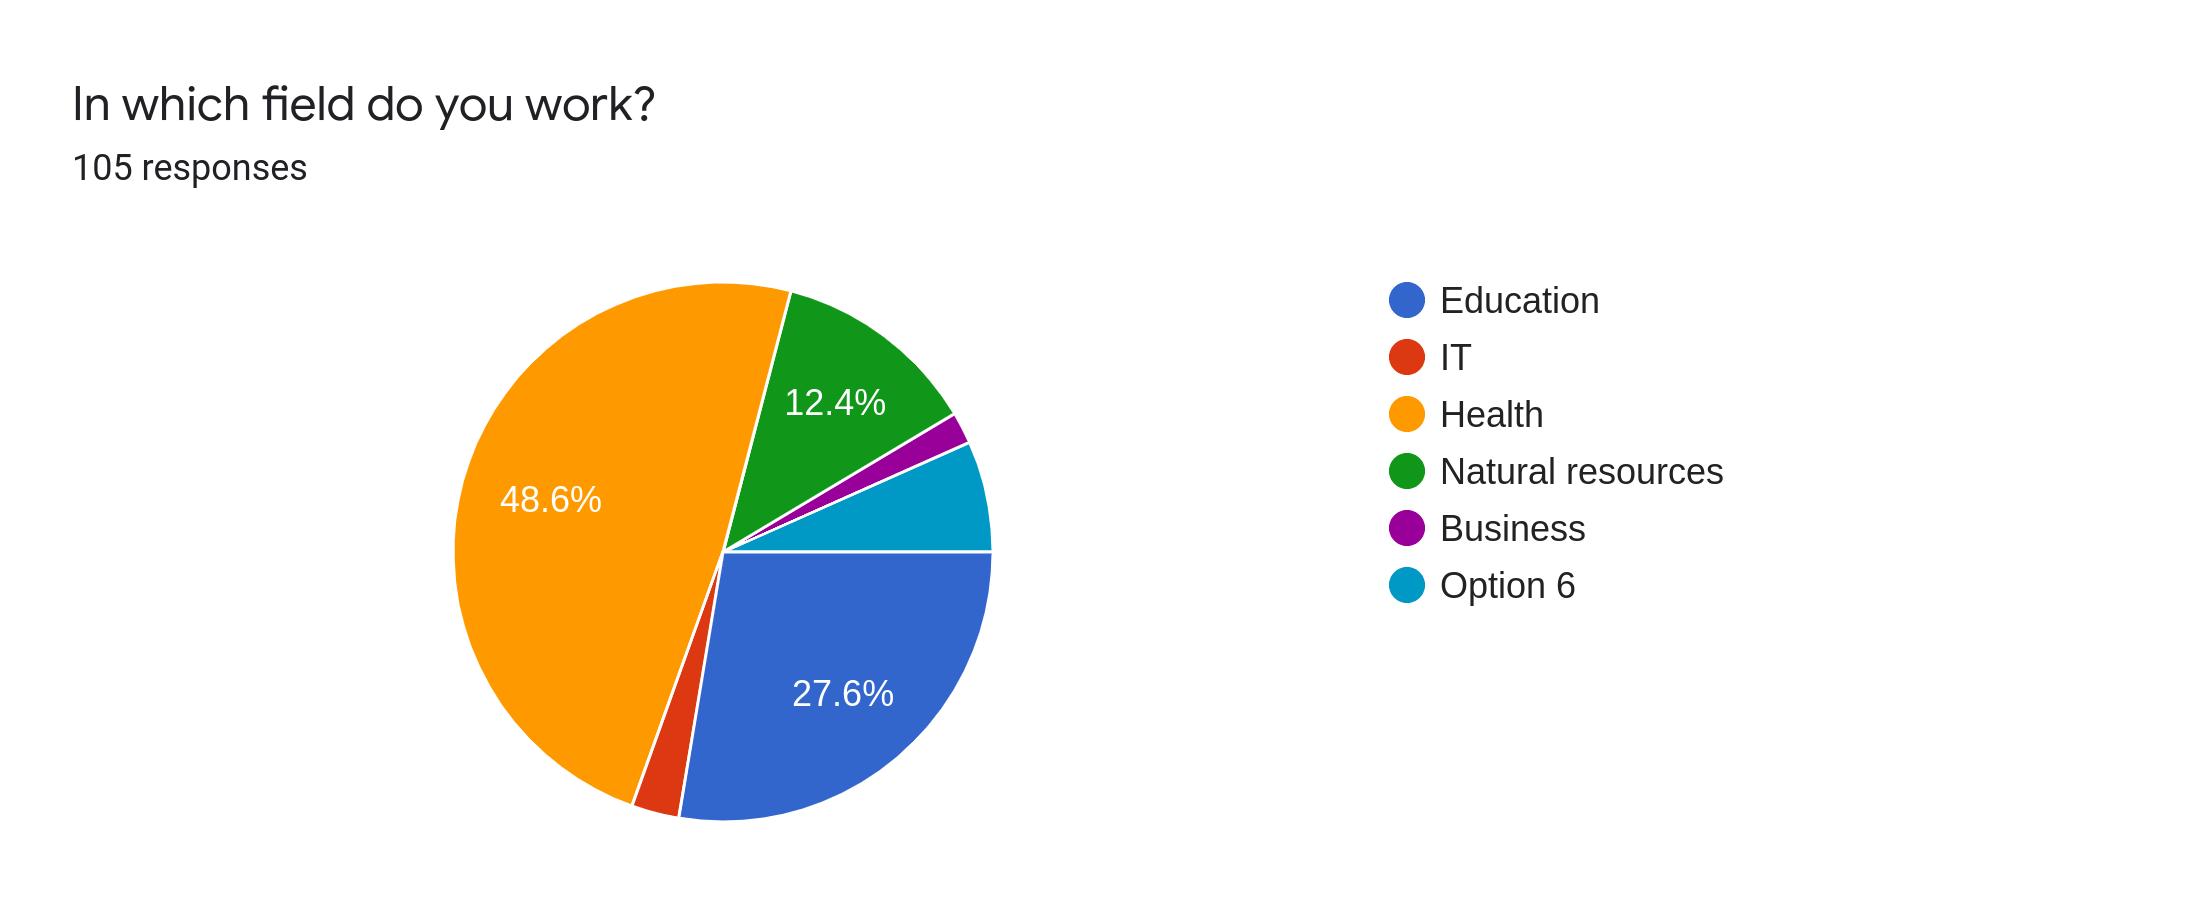
It was great to see the diversity in occupations of those interested to learn mapping in R. Nearly half of those that registered worked in Health, and a quarter in Education. This partly reflects our targeting and shows good potential for health impact that is important for us and our primary funders, the Wellcome trust.
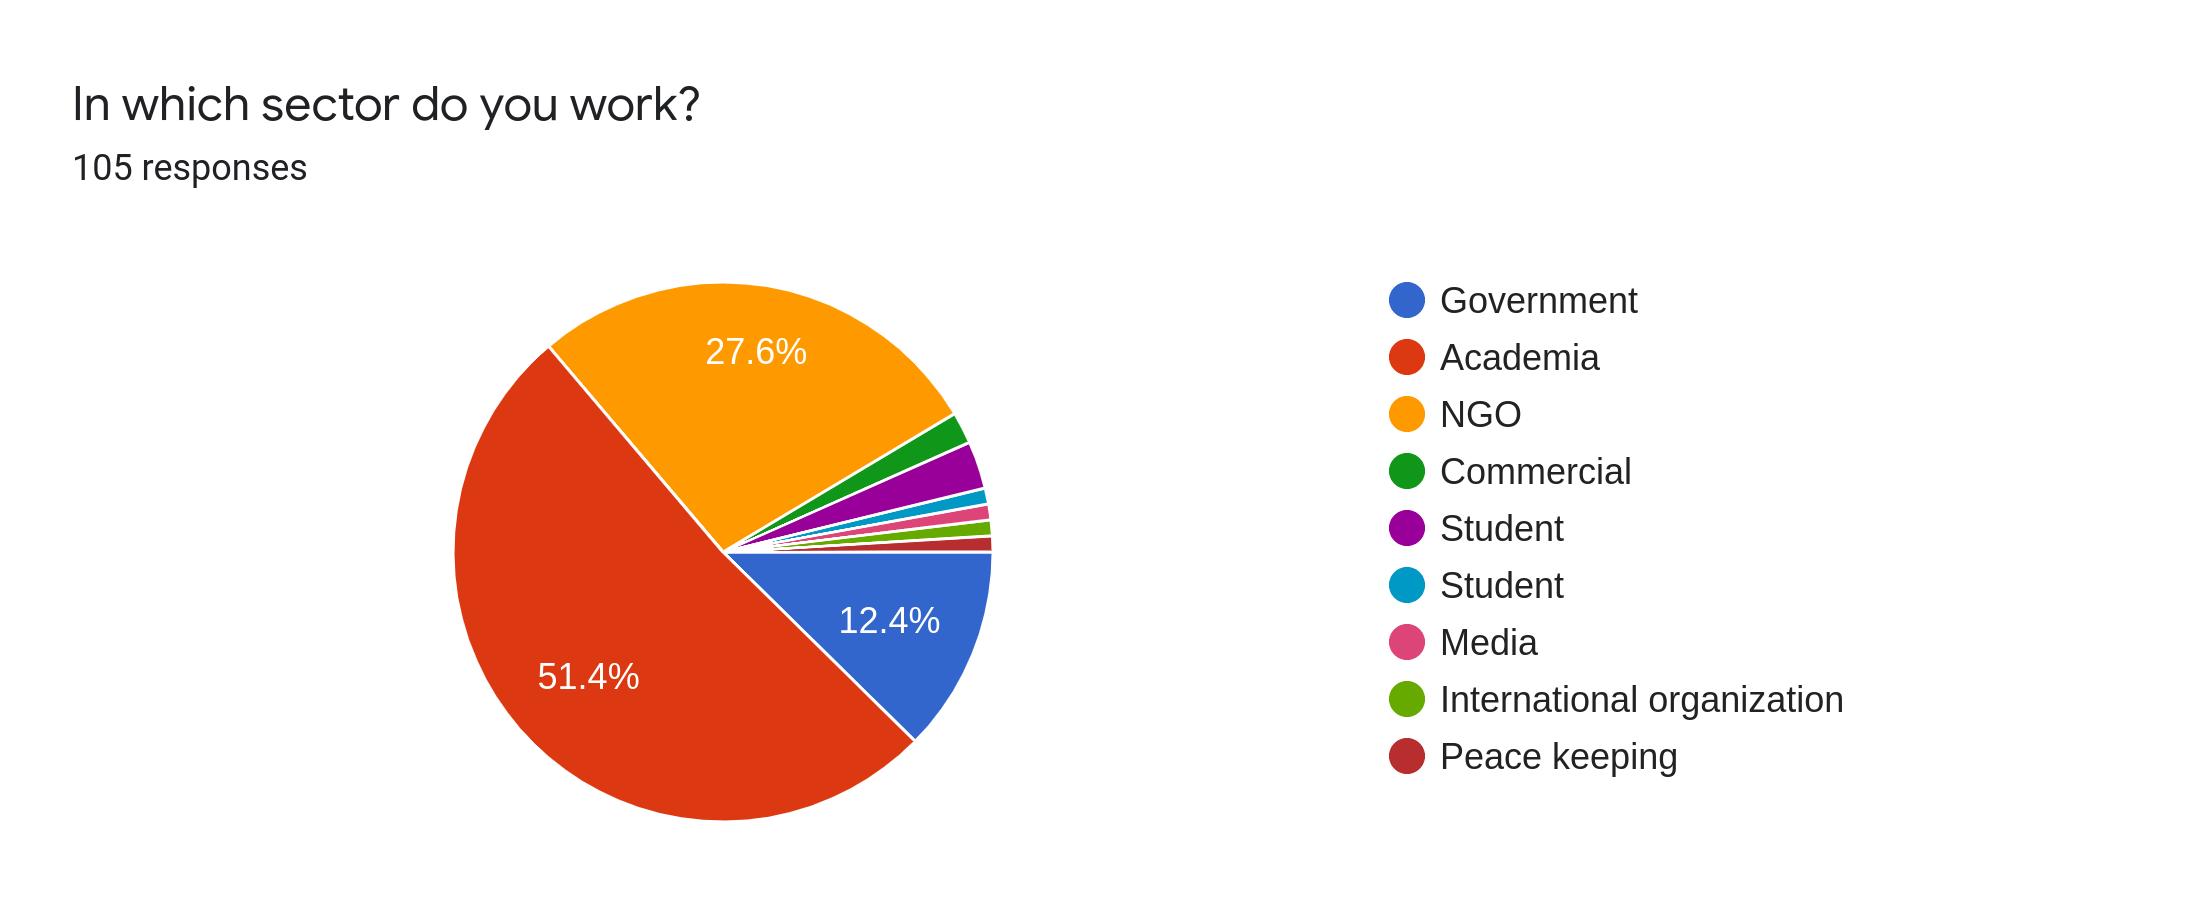
51% worked in Academia, 28% for NGOs and 12% in Government. The high numbers from Academia likely reflects the popularity of R (& twitter !) there. We were also happy to see interest from the more operational sectors of NGOs and Government. This gives an indication of the potential to share R techniques across sectors to achieve maximum impact.
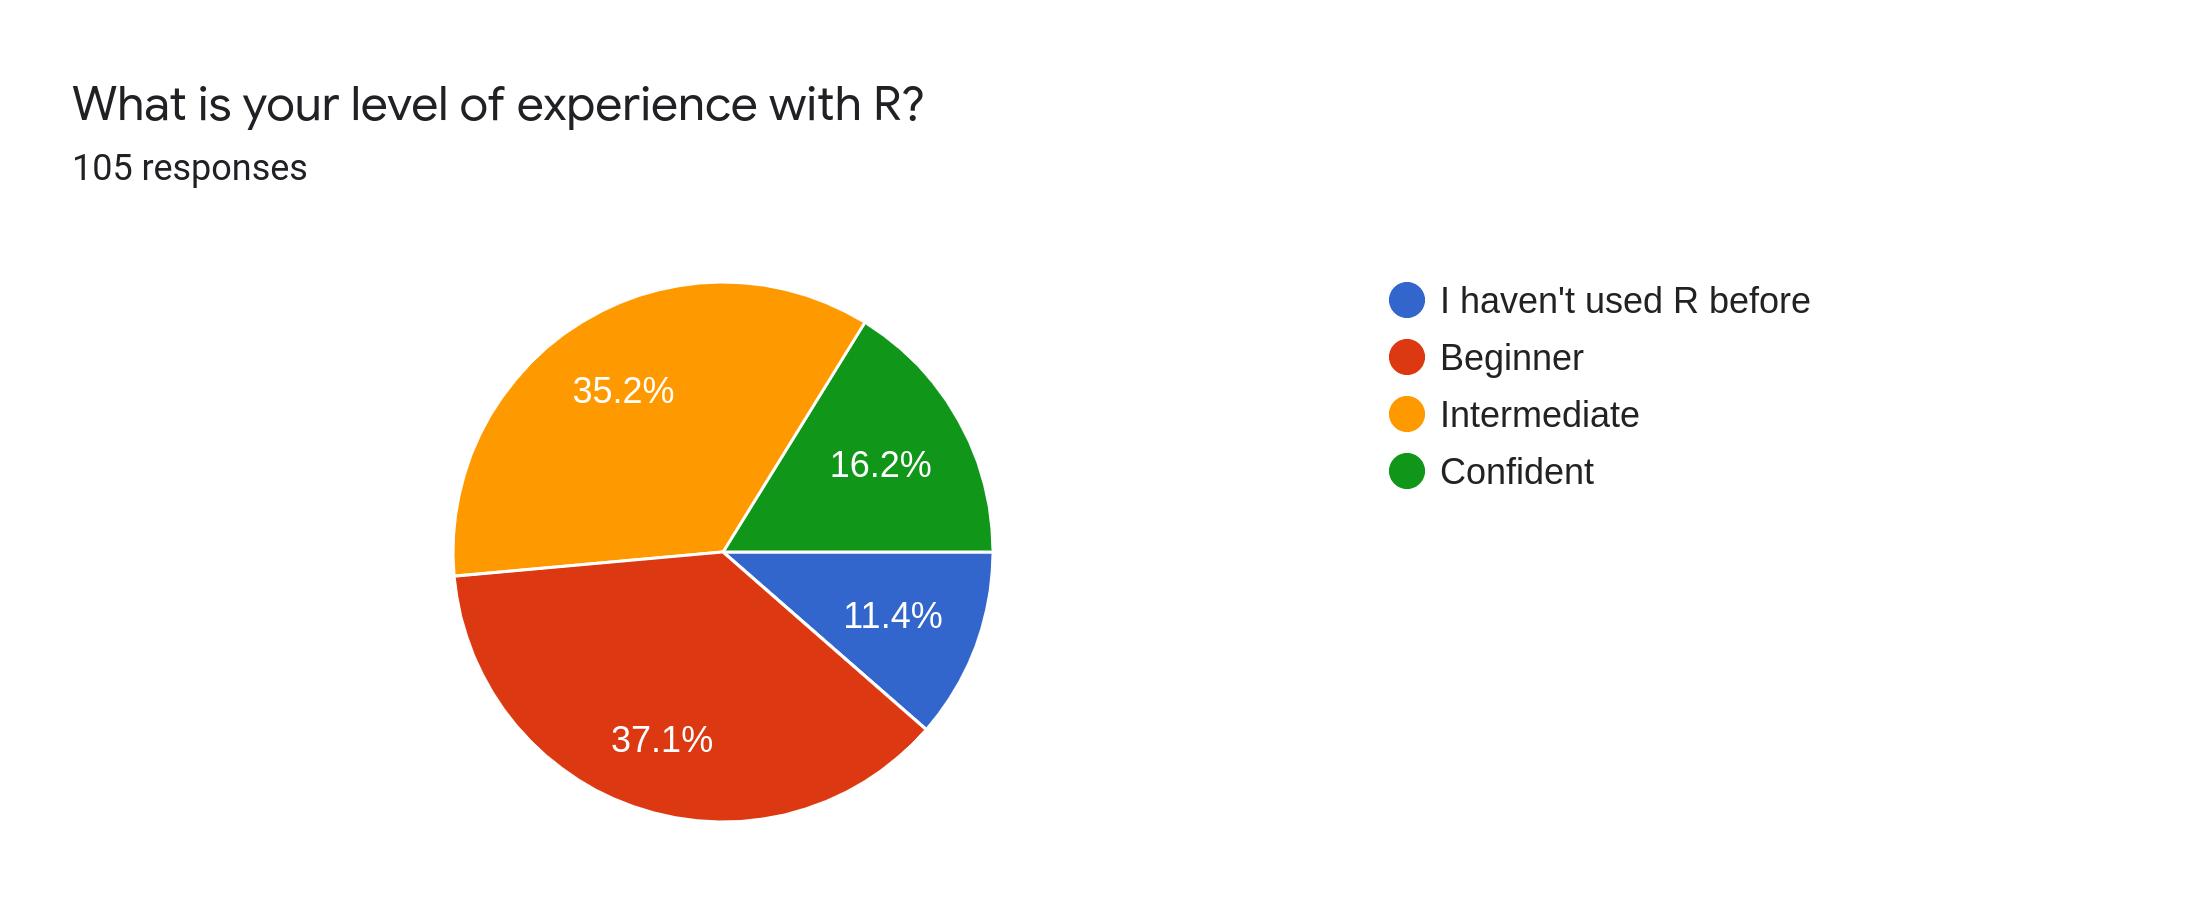
We were excited to see a good range of R experience, centred on those identifying at beginner and intermediate levels. This will help us target our resources in future. We see high potential for resources targeting those that are relatively new to R. One challenge for us is also to reach out to those with more experience to see how we can help them share their work with the community.
During the session we shared information about the project, resources that have been developed, and our plans for the future. We also sought interested participants for a three-episode online training series trialing our new tutorials. We’ve just completed that and will report here soon.
The Q&A session attracted a good selection of questions, you can listen to them and our responses in the video above. We were asked about whether we could provide help to those mapping their own data, our target audience and outputs, comparisons between R & Tableau, and any plans to build capacity in Africa. If any questions do remain for you then please do reach out to us.
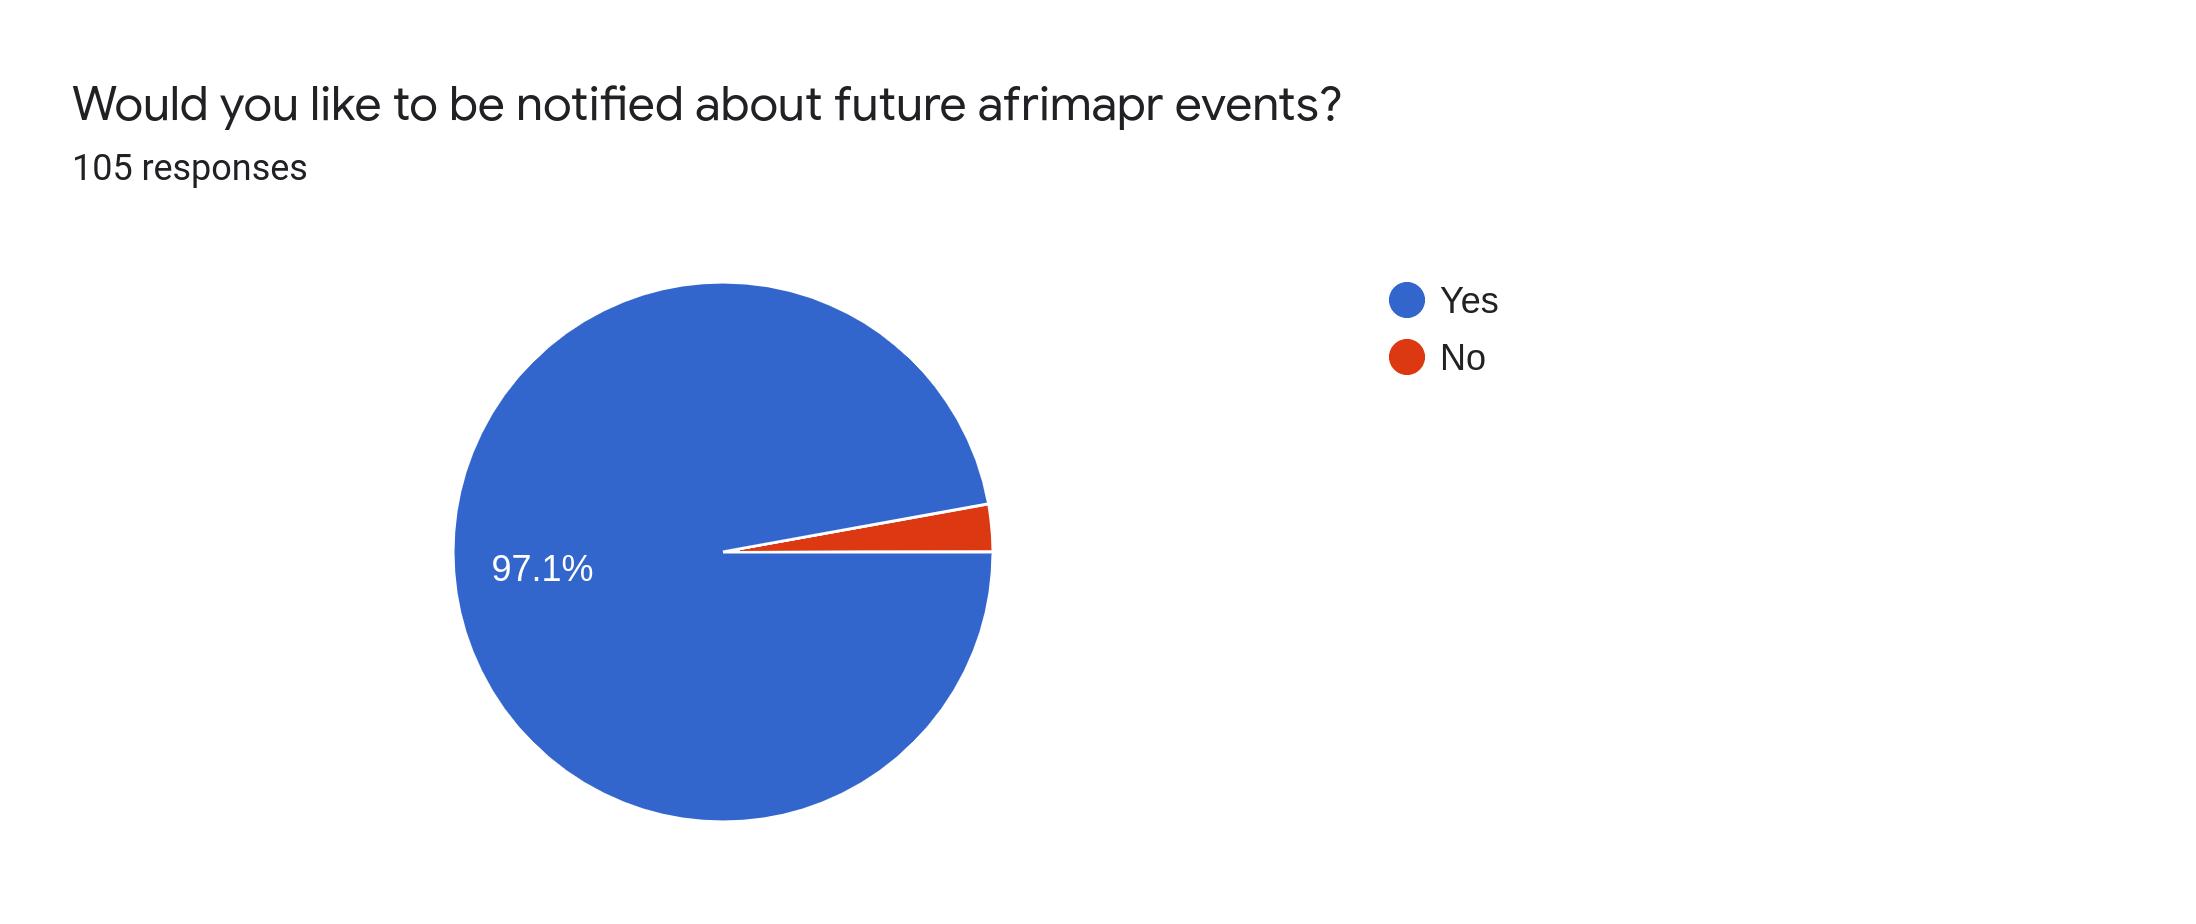
It was good to see that there are plenty of people working in Africa who are interested in what we are doing and want to hear more from us. We will keep you updated on our progress.
