In this post we present a series of new interactive learnr tutorials we are working on to support the development of R spatial data skills in Africa.
In our tutorials we present students with real spatial data examples and the scaffolding to get them experimenting with changing code and making maps right from the start. Students can either work through the tutorials online or download the afrilearnr package and run it locally in R.
Each of our modular learnr tutorials builds on the data package, afrilearndata, presented in a previous post, which contains example open spatial datasets from Africa.
So far we have 3 tutorials in progress. The links below will take you to demo versions that you can go through online.
-
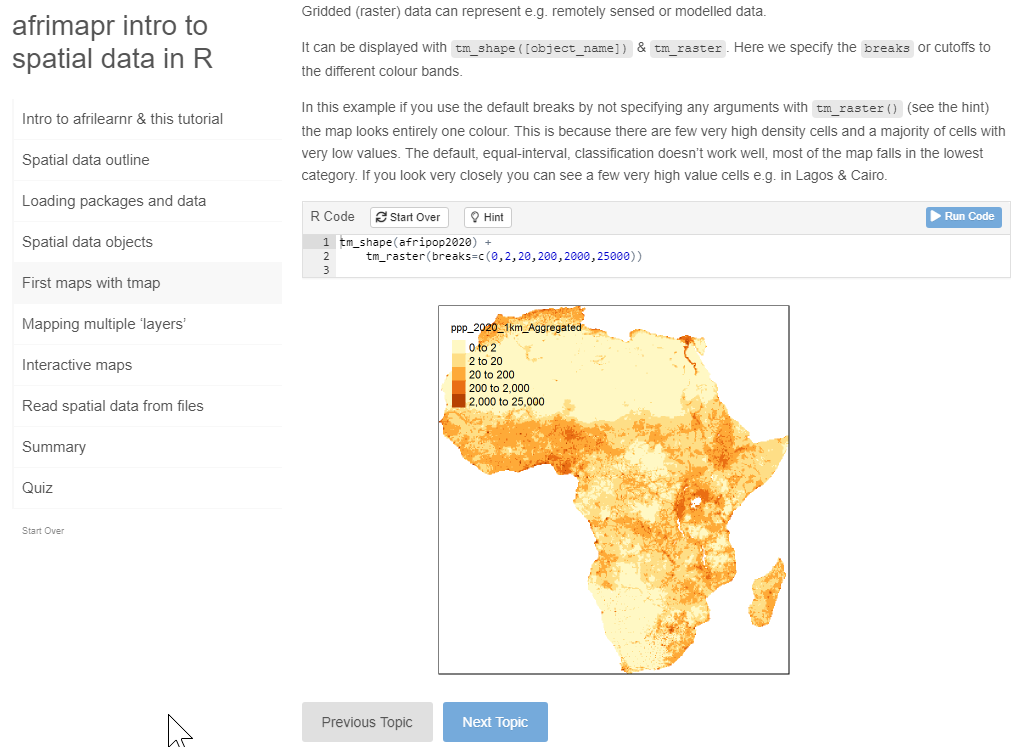
Introducing spatial data types in R, the packages sf, tmap and raster, with data from afrilearndata.

-
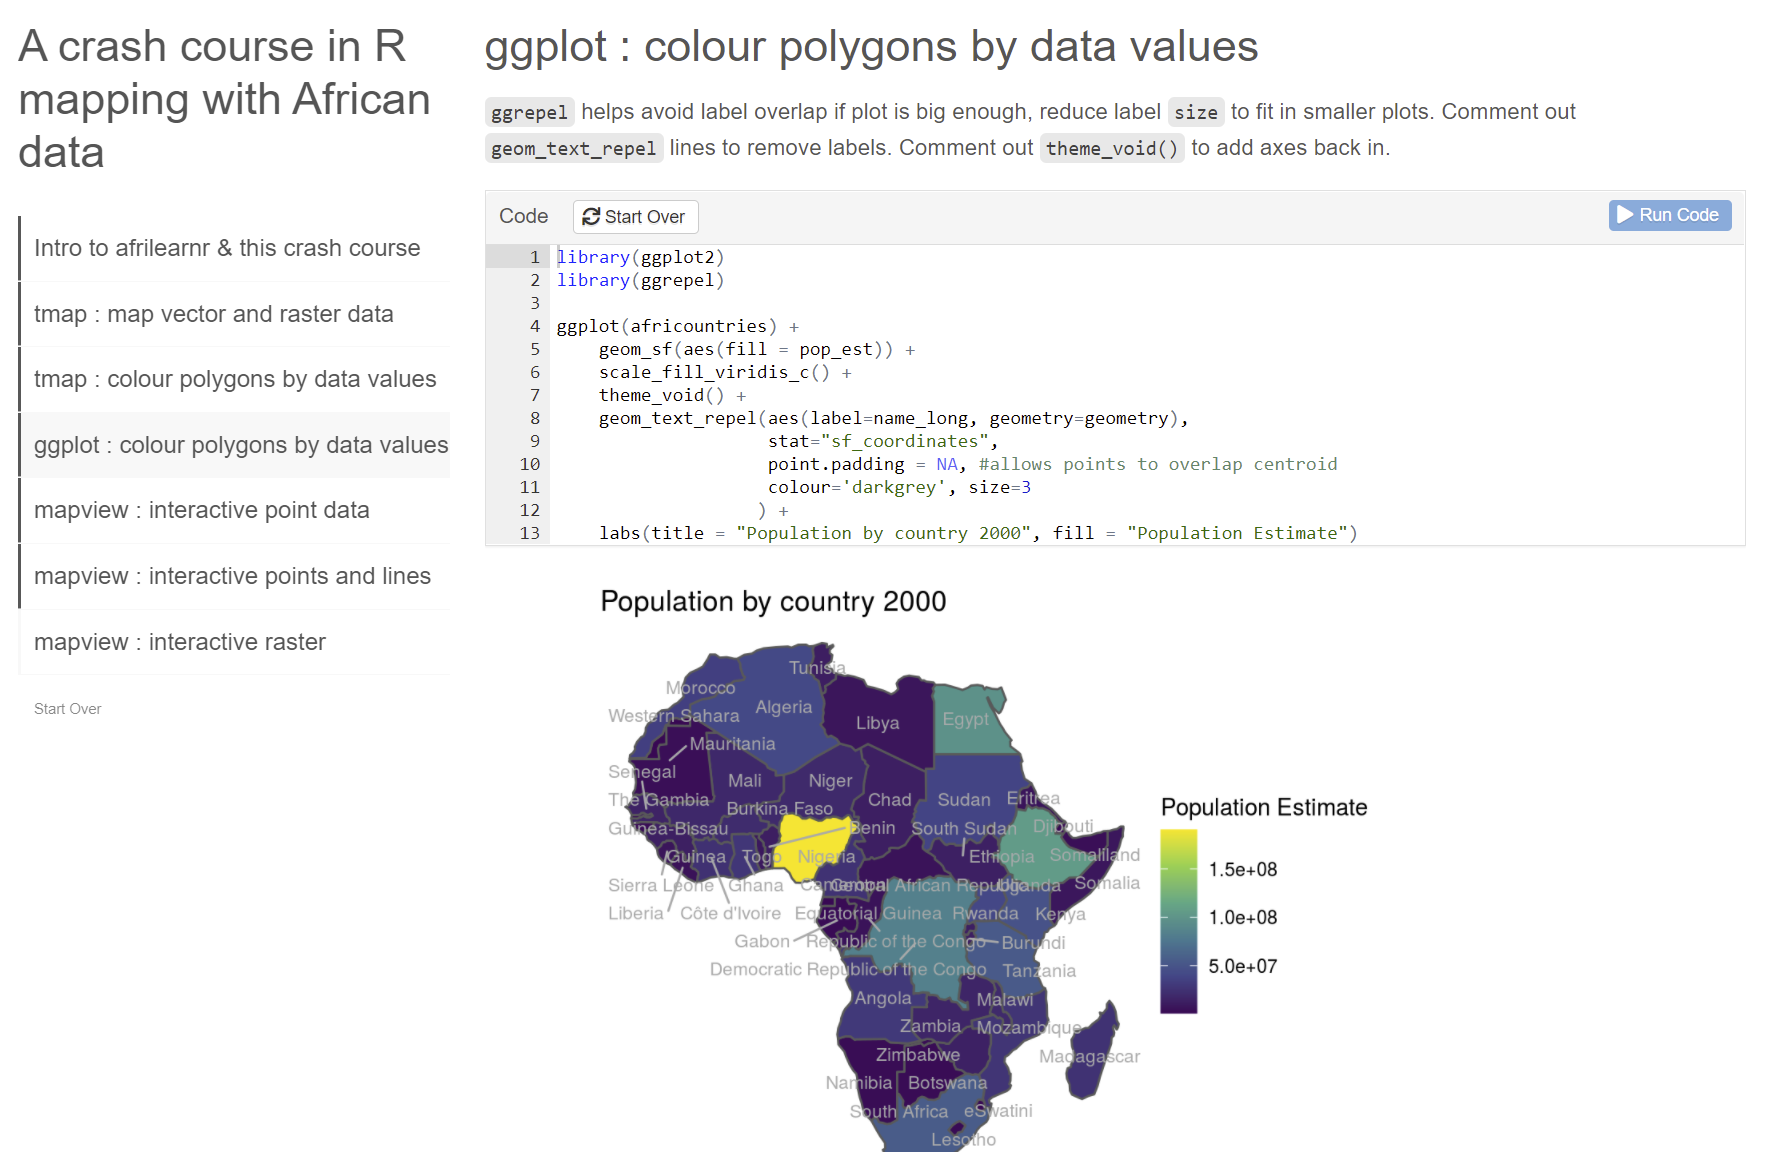
A gallery of example plots using tmap, ggplot2 & mapview that you can modify yourself, little explanation.

-
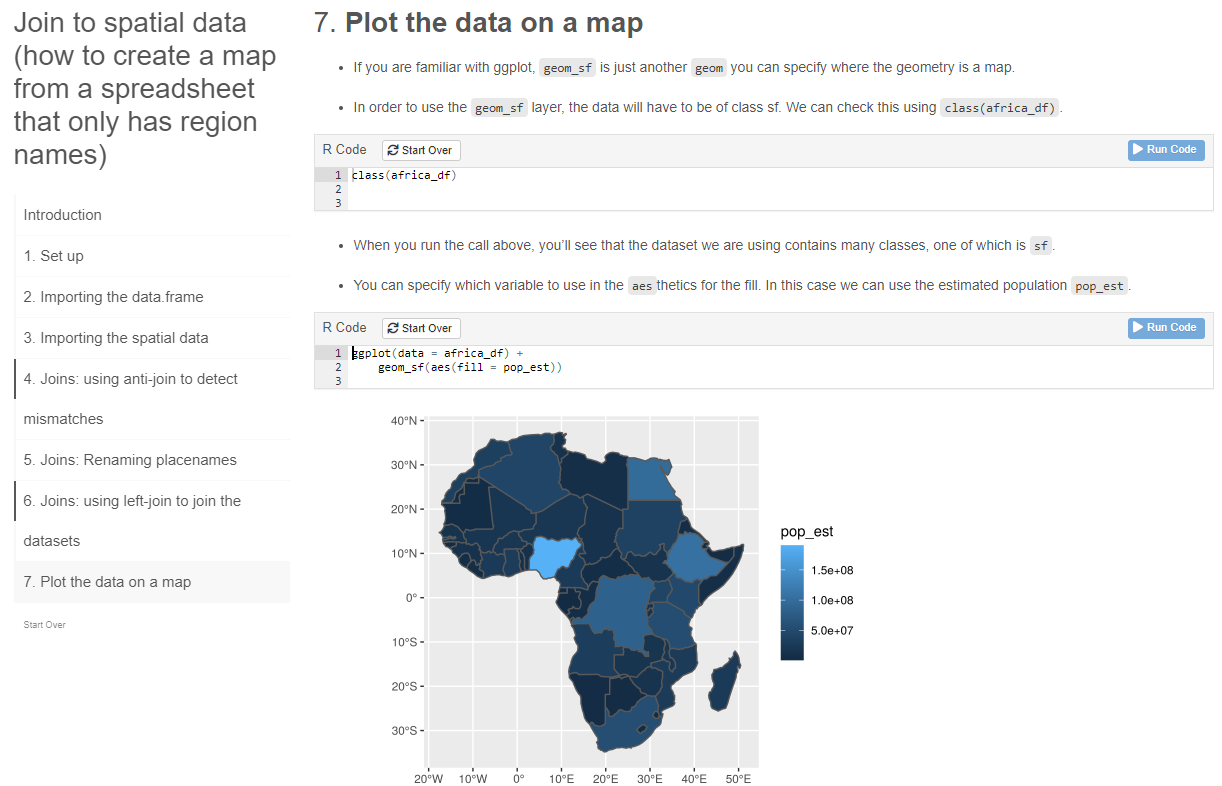
joining spreadsheet data to a map
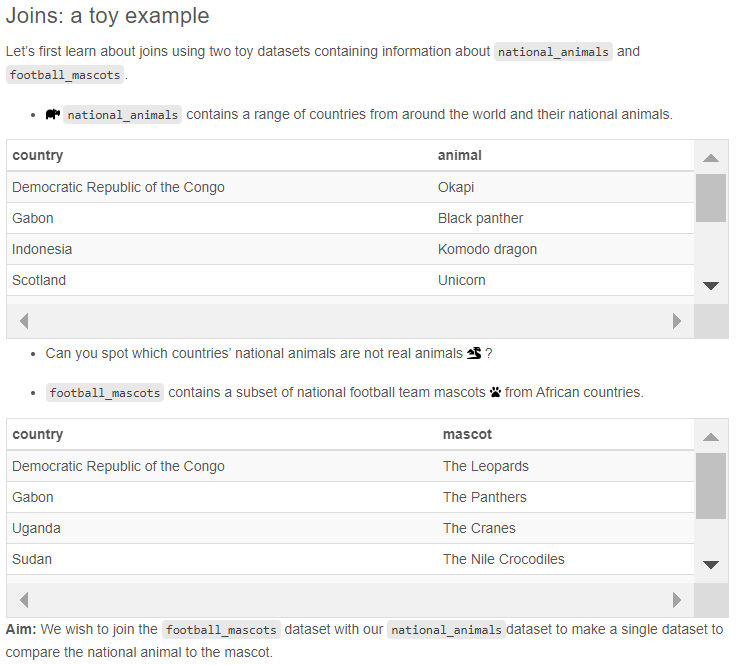
A step-by-step run through of how to create a map from a spreadsheet of summary data by region. What you need to do, in technical speak, is ‘join’ the spreadsheet data onto some spatial data. The afrijoin tutorial takes you through that process via some key motivating examples, like football mascots!


We welcome feedback, we are discussing how best to structure our learning resources to support needs from different communities. What do you think? Do you need easier or harder techniques ? Do you prefer resources with more or less explanation ? What would you like us to cover next?